STA323 Survival Analysis Project
Section 1
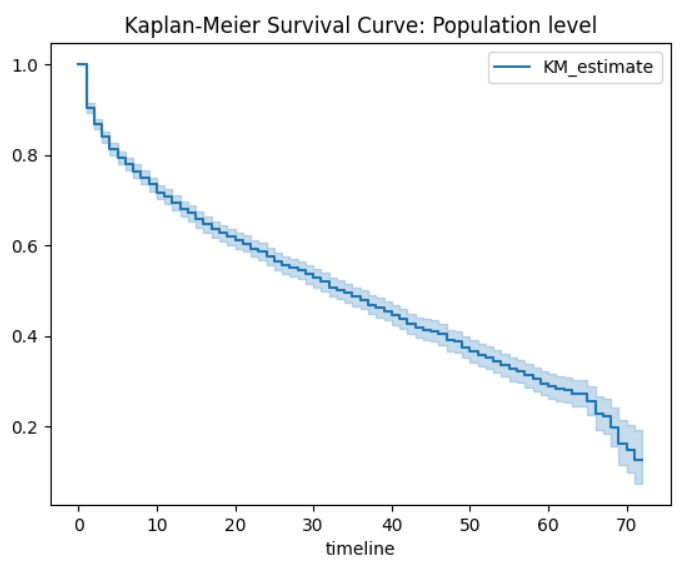
In the case provided by Databrick, the task of survival analysis is using the Tenure to estimate the probability of whether the customer is still with the company by fitting the Kaplan-Meier model to the dataset, and we have our result plot here:
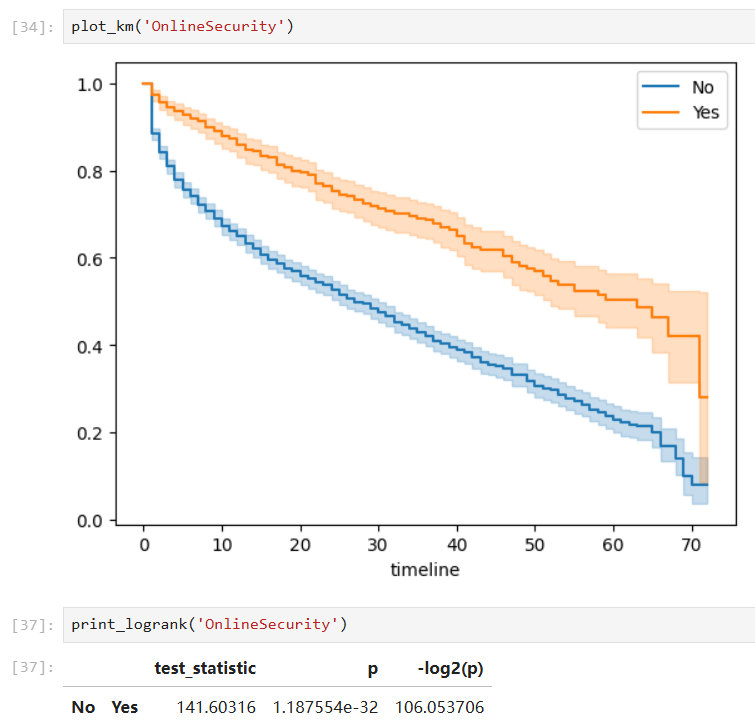
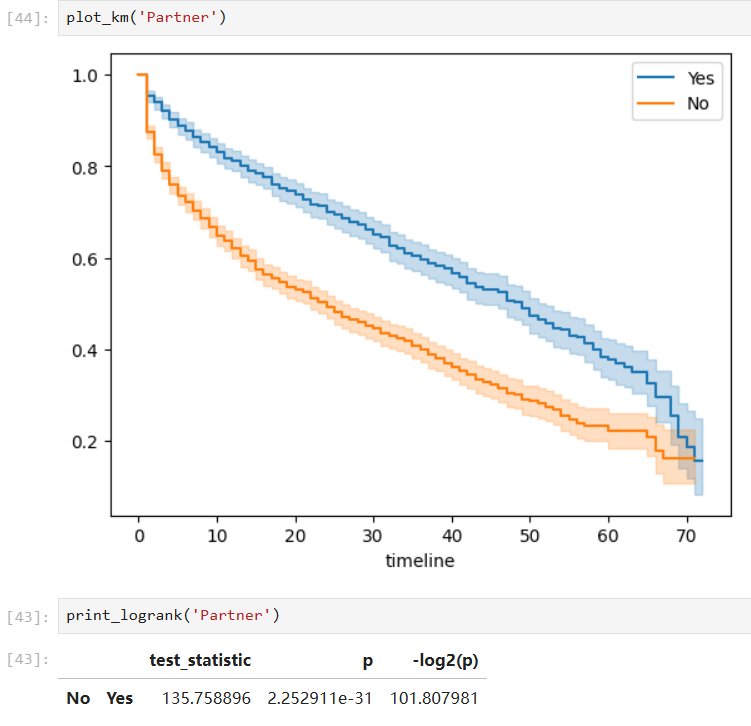
Furthermore, when a covariate is considered in this problem, we can conduct such analysis on different groups respectively and hypothesis tests (pairwise log-rank test) to check whether the groups are statistically equivalent.
-
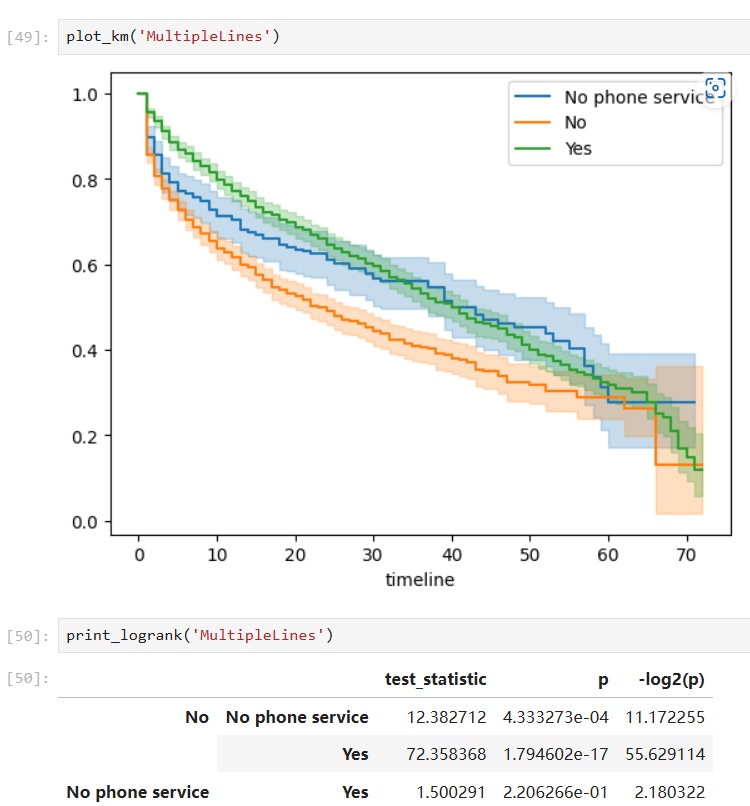
Covariates with insignificant group differences:
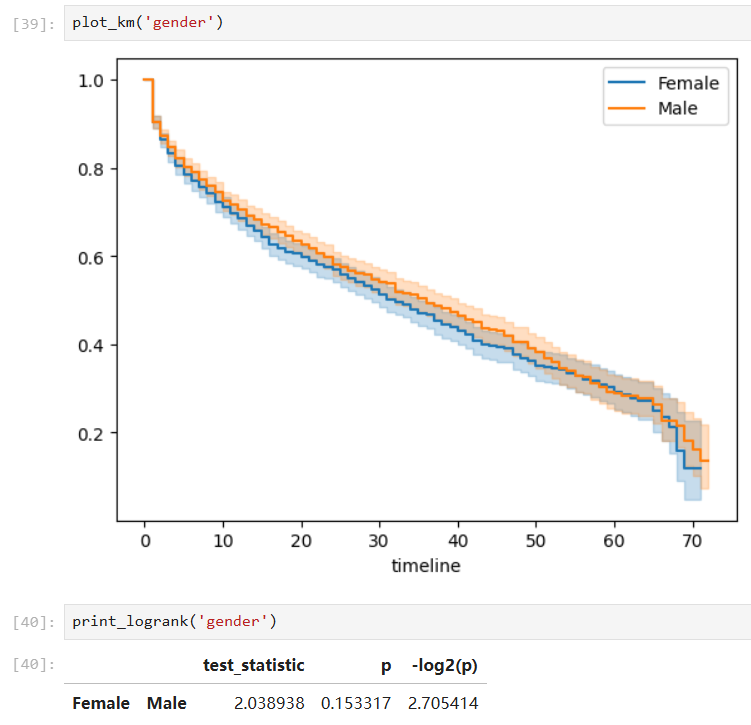
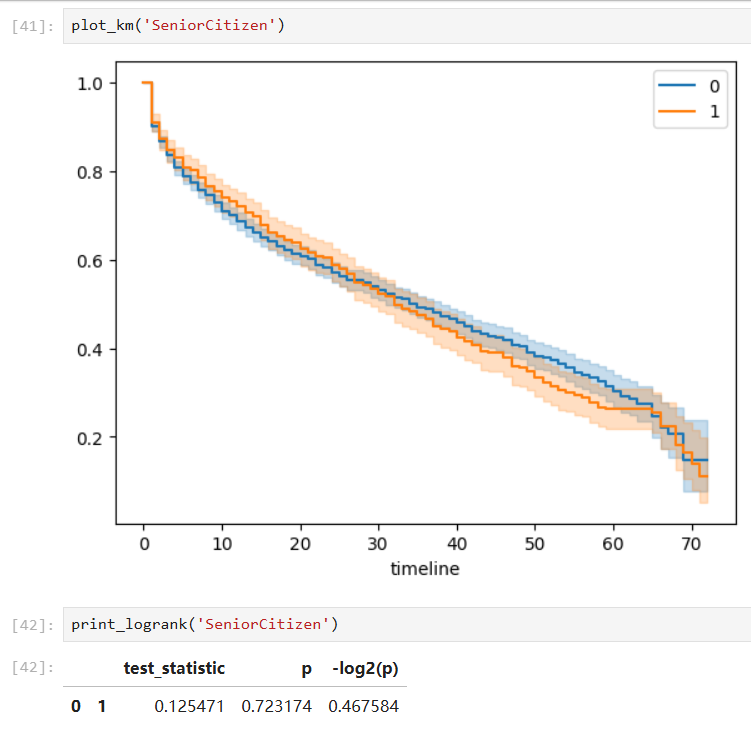
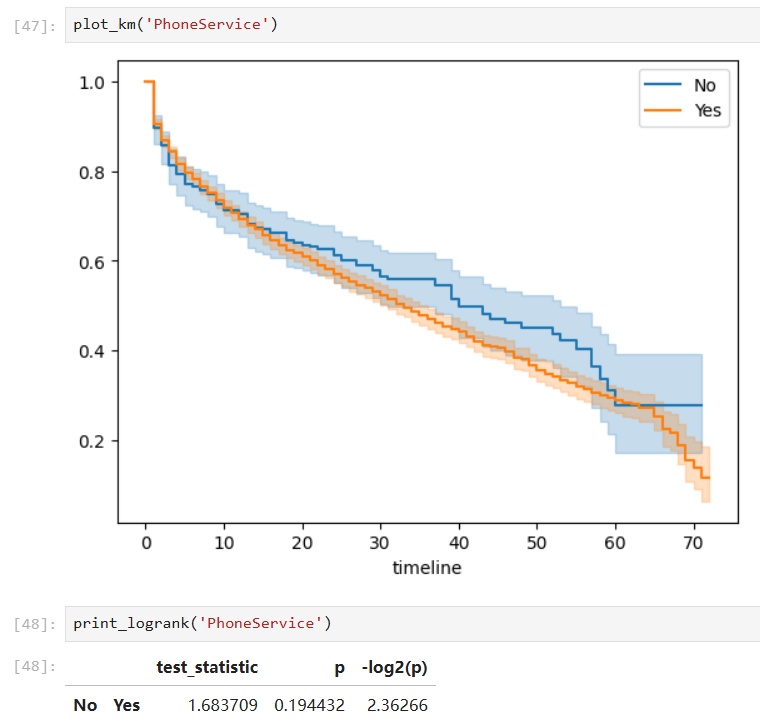
-
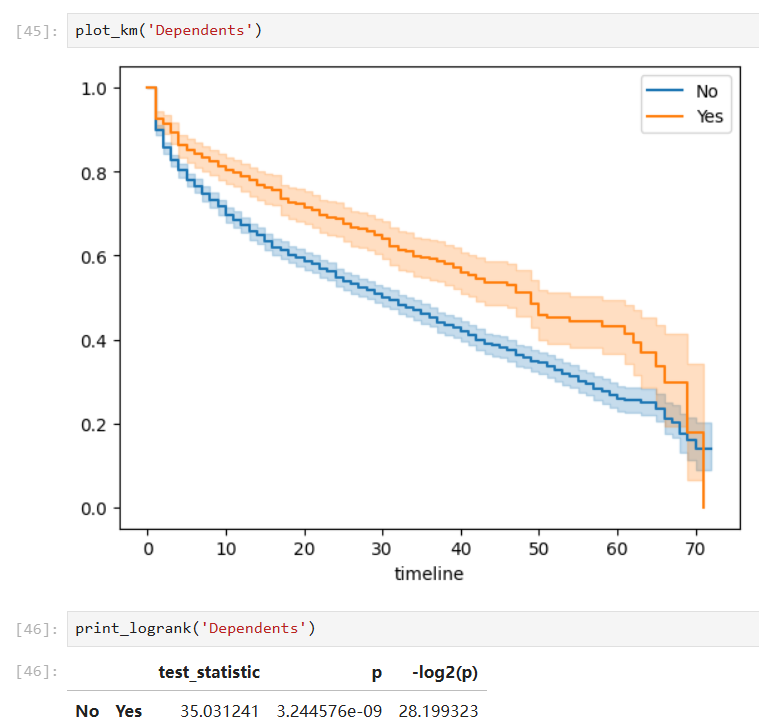
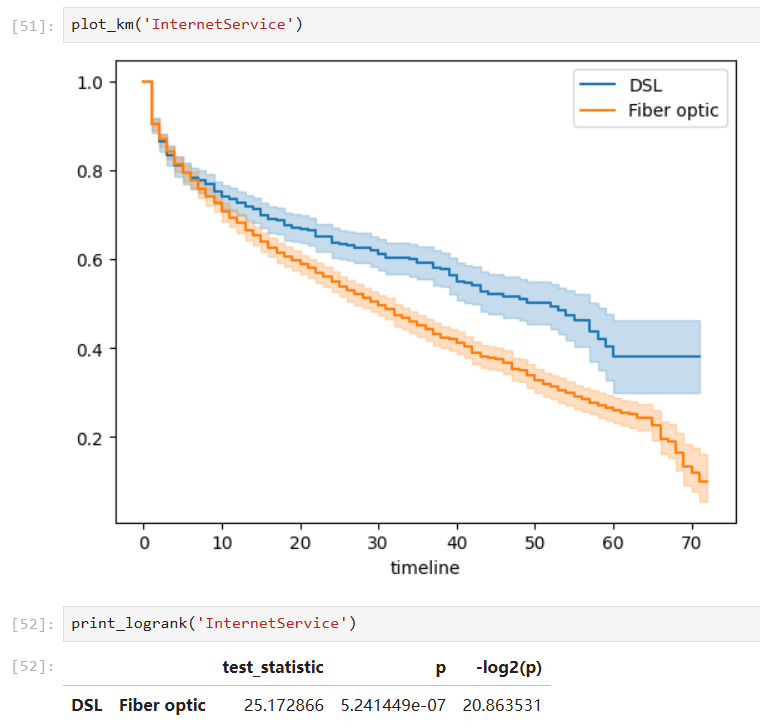
Covariates with significant group differences:
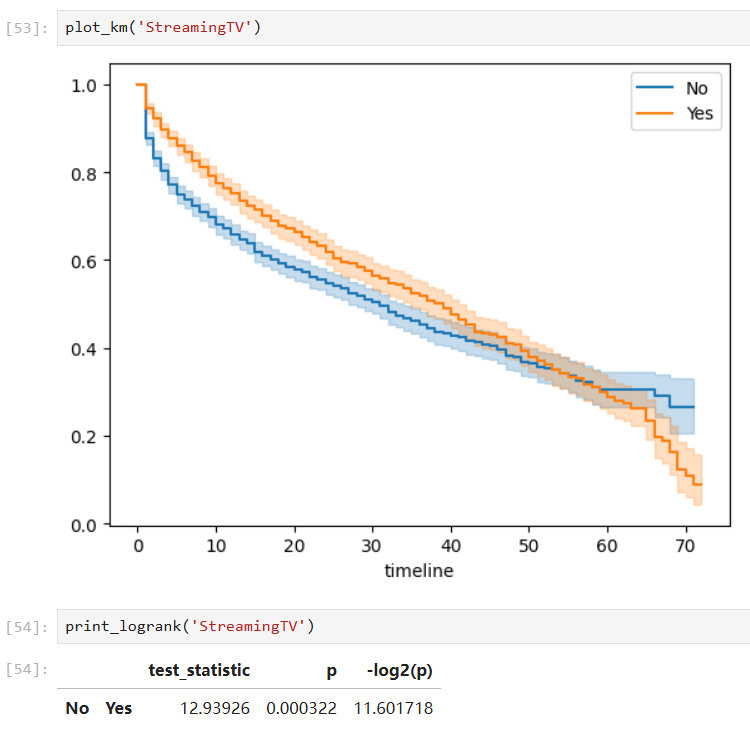
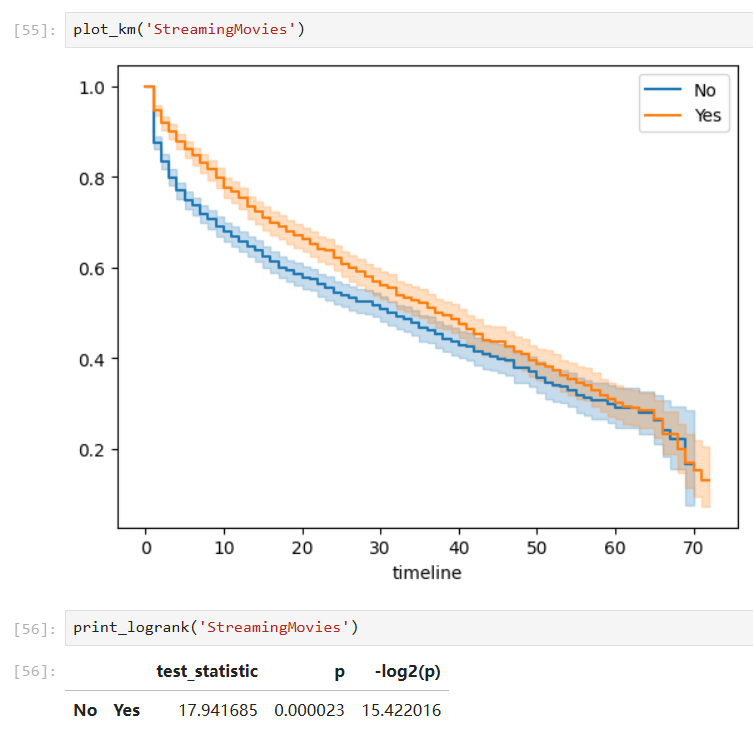
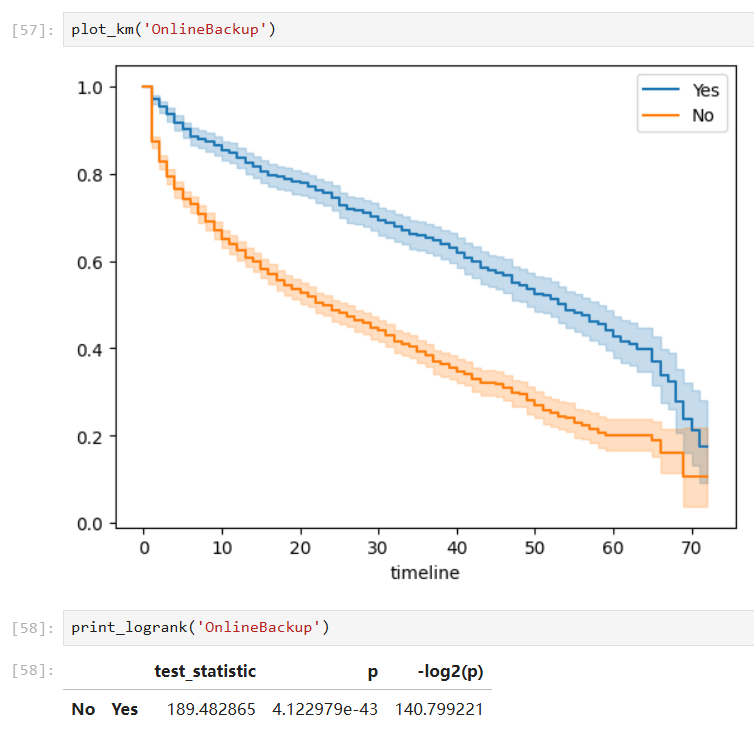
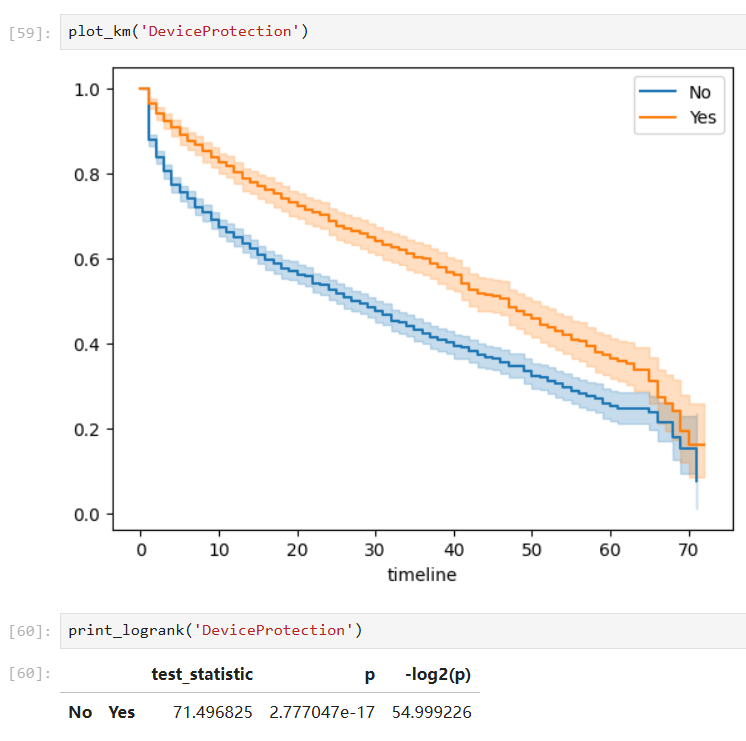
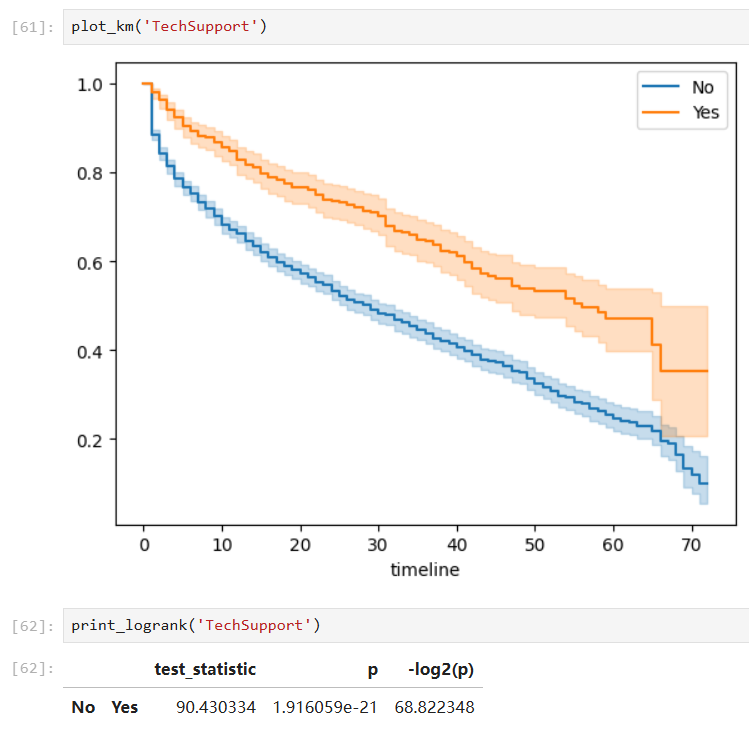
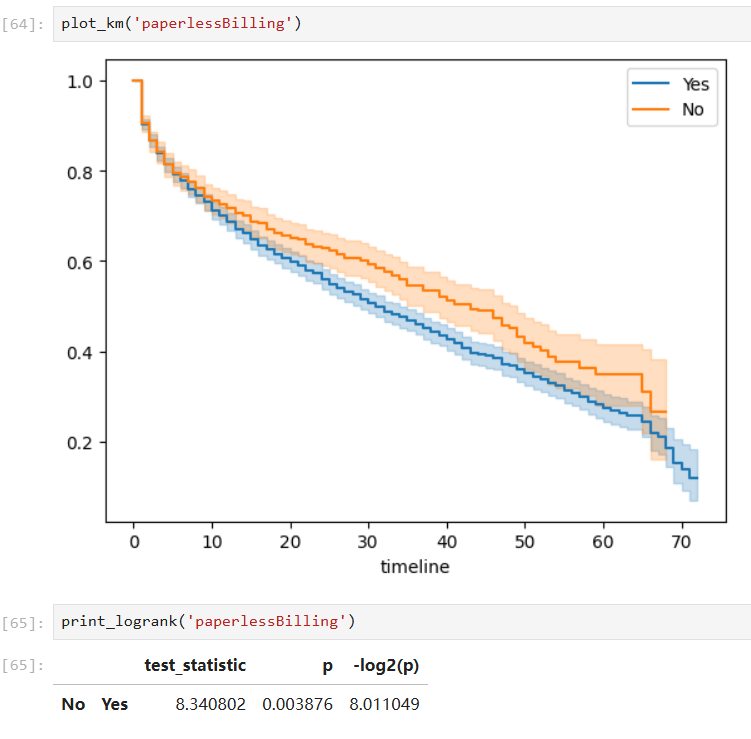
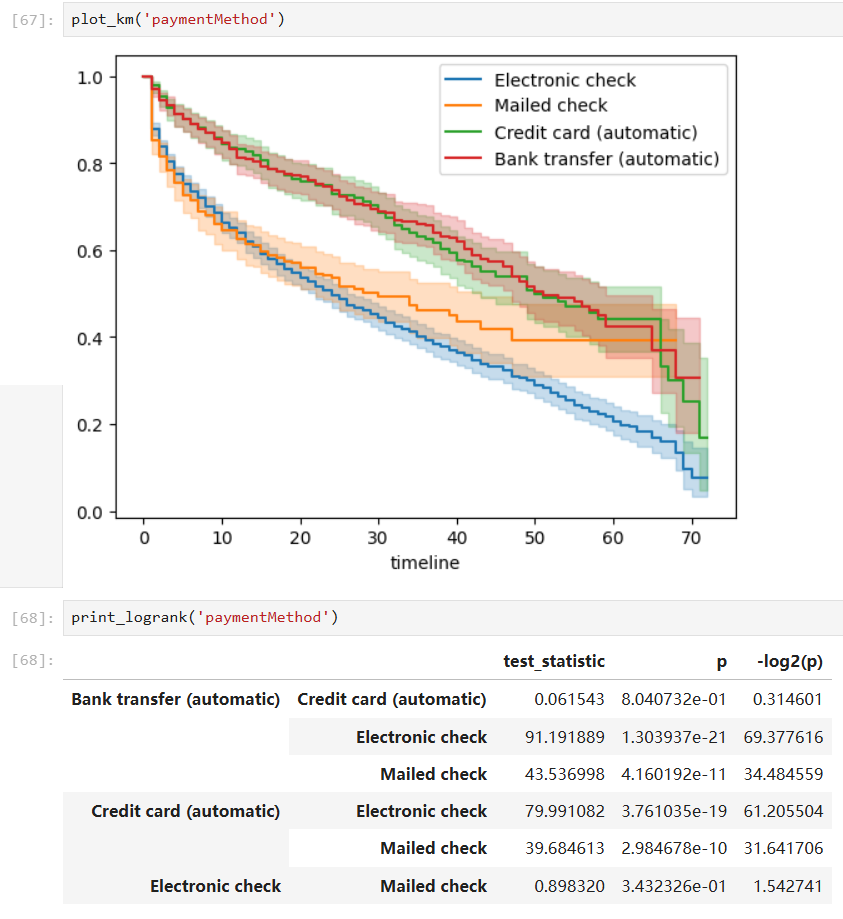
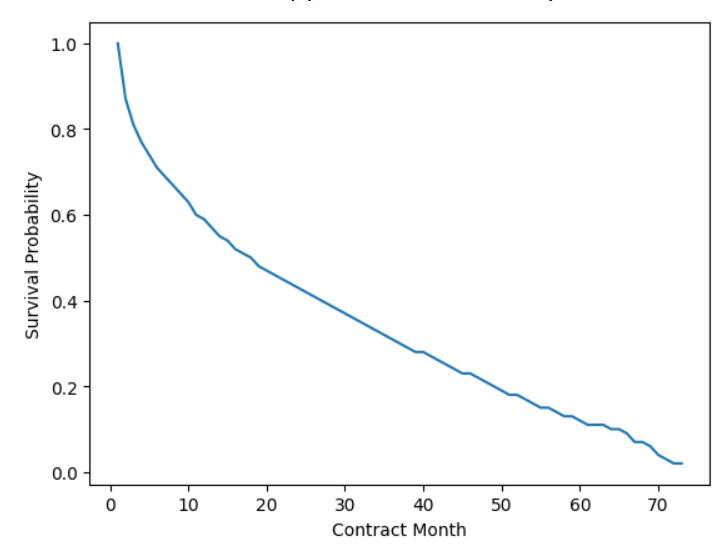
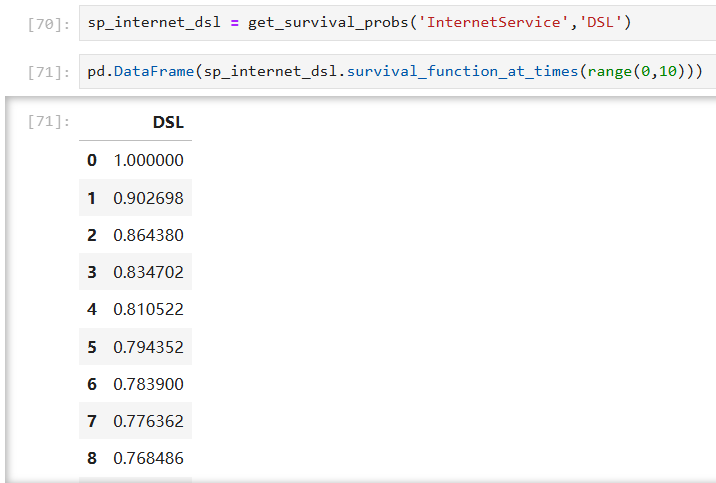
With such a fitted model, we can also predict the survival probability given a time value in a certain group:
Section 2
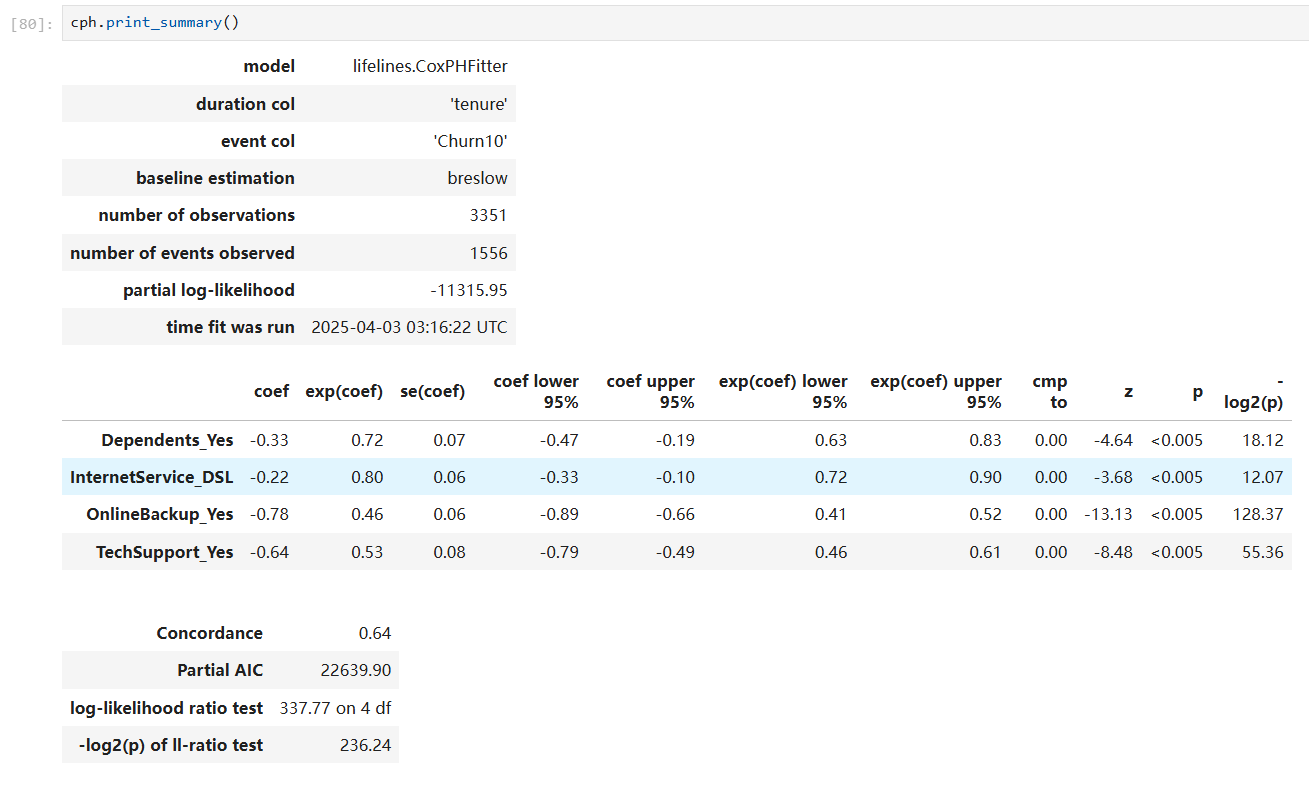
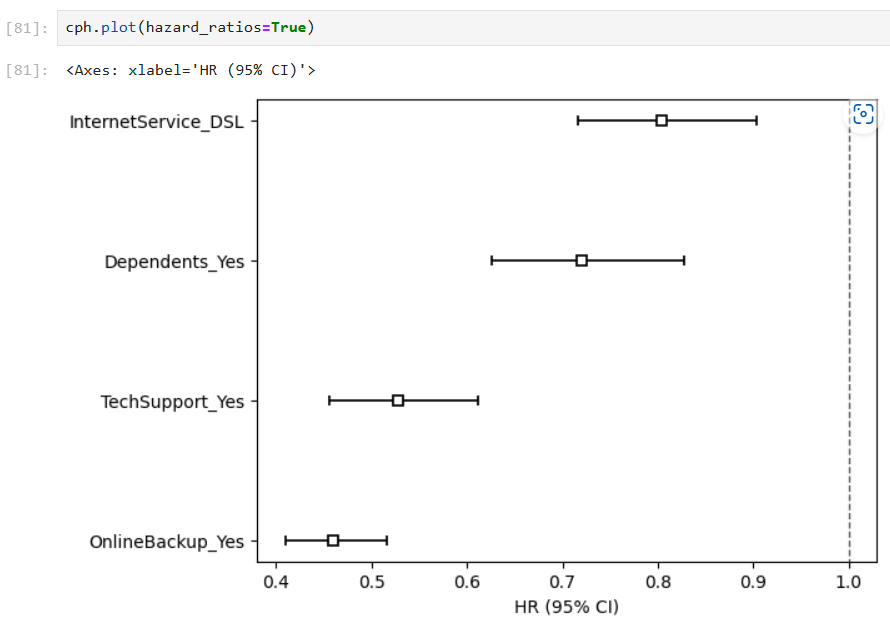
Meanwhile, we can also use the Cox Proportional Hazard model to predict the probabilities of failure in different groups:
$$h(t) = h_0(t) + exp(\sum_i b_i x_i)$$
in which it is assumed that the influence of time and different covariate categories can be separated.
After converting the values of categorical variables to 0 or 1, we have our fitted model:
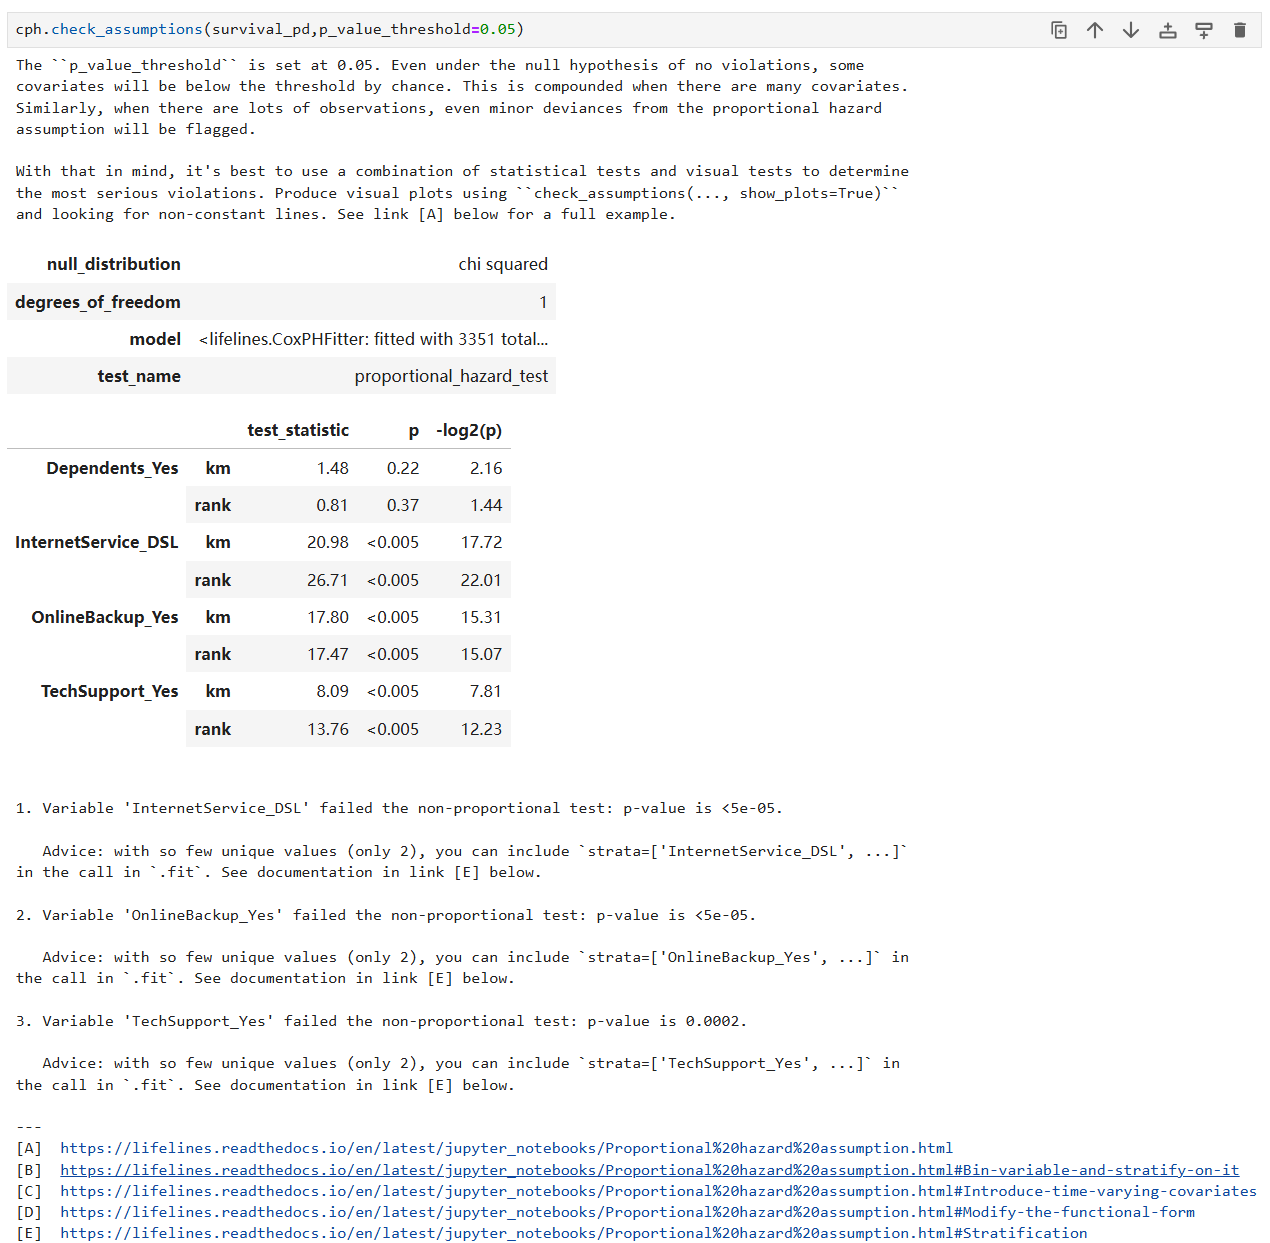
Then, the proportional hazard test is used to check whether the requirements assumed are met:
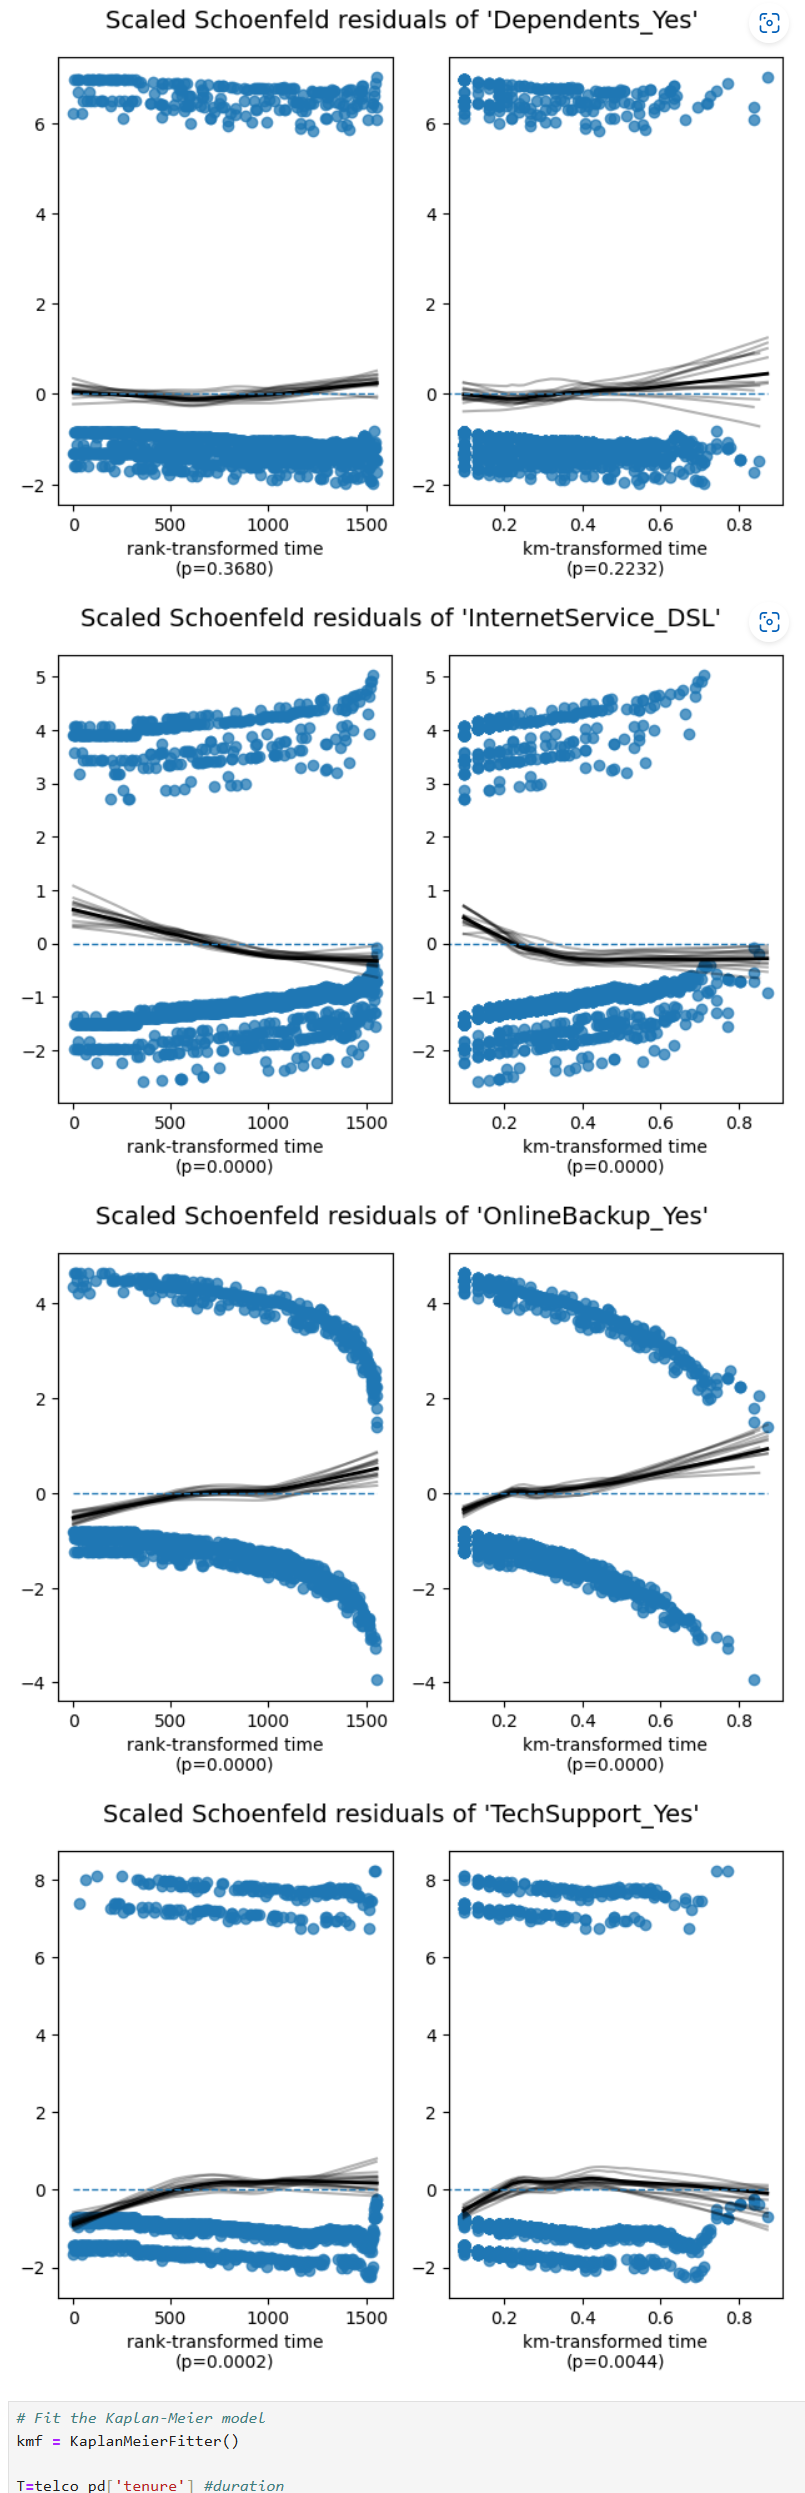
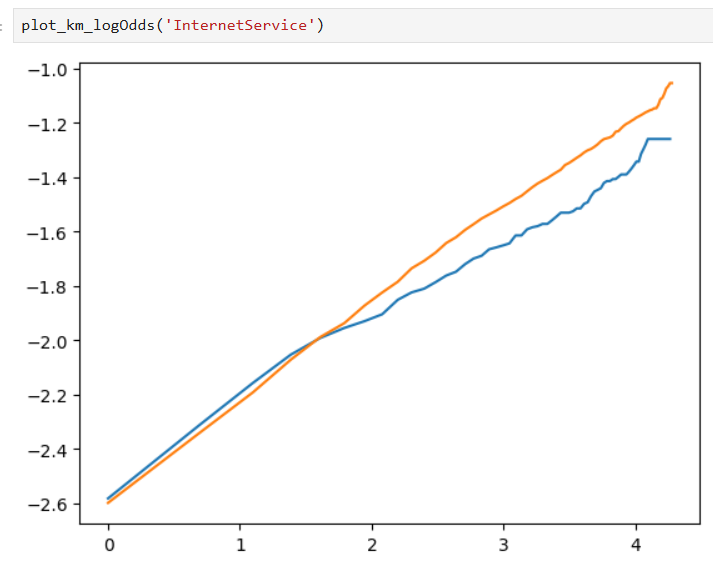
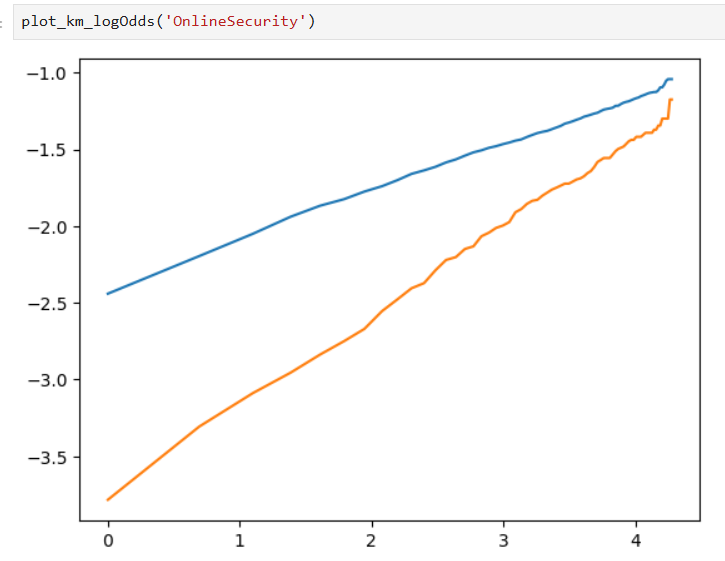
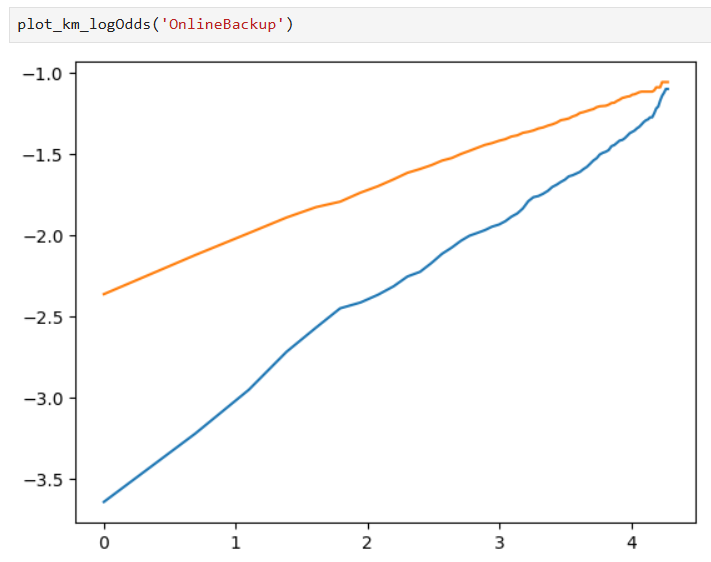
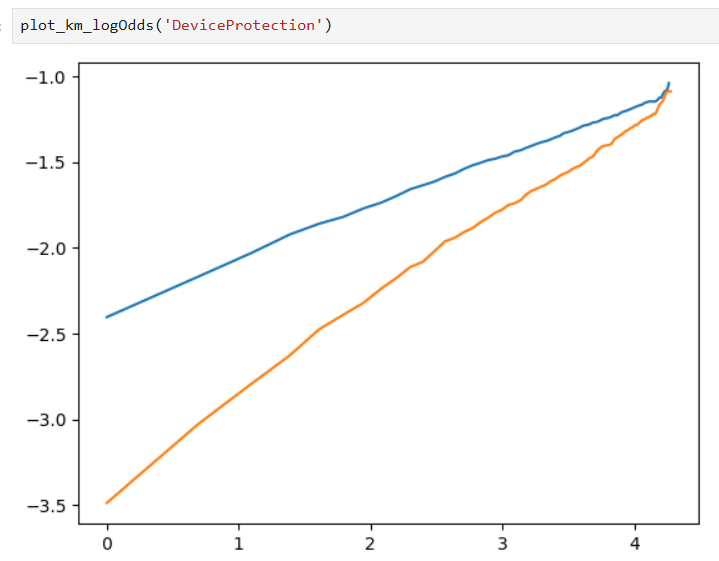
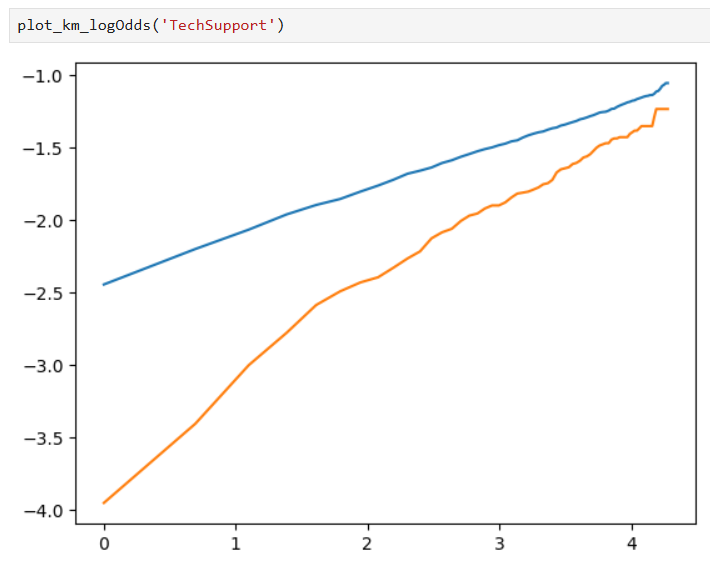
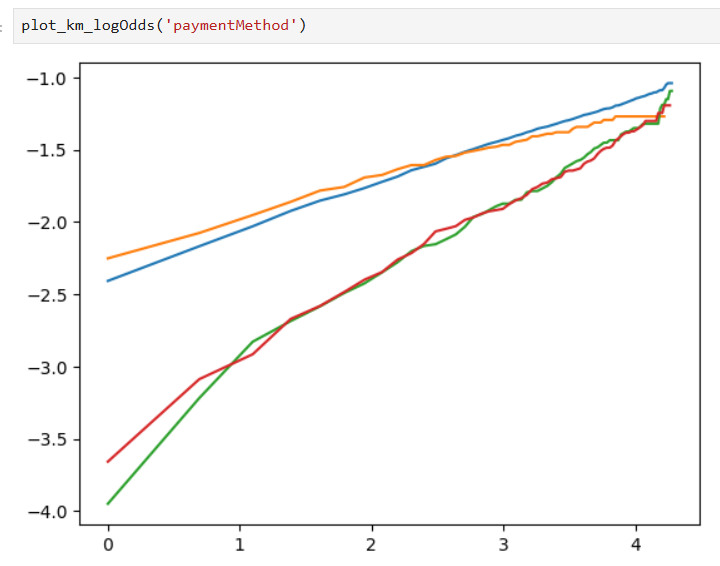
Also, Kaplan-Meier curves on a log-log scale can be used as well for a better view of our results:
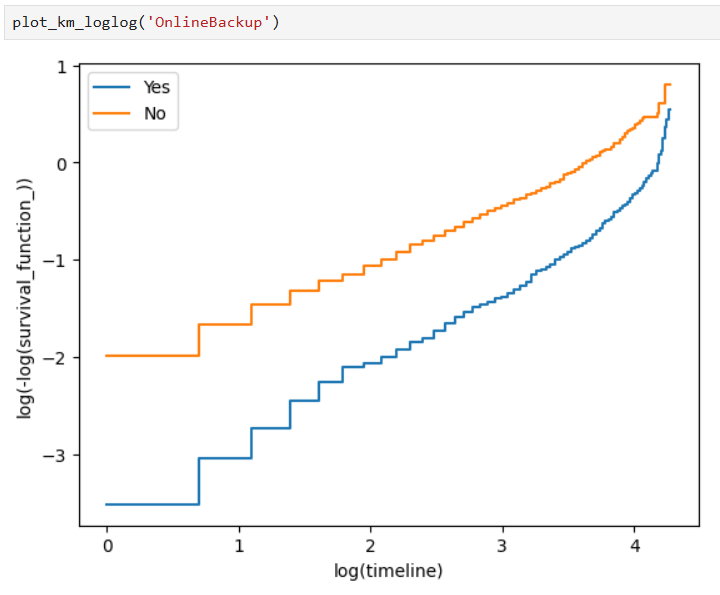
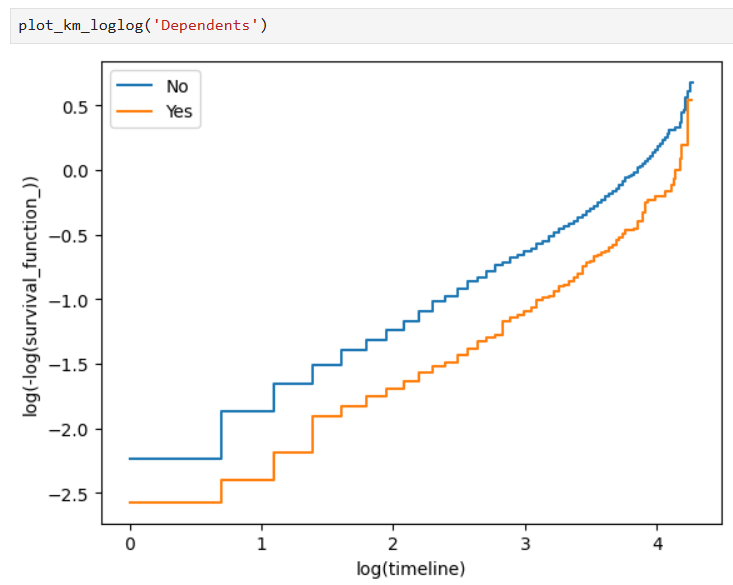
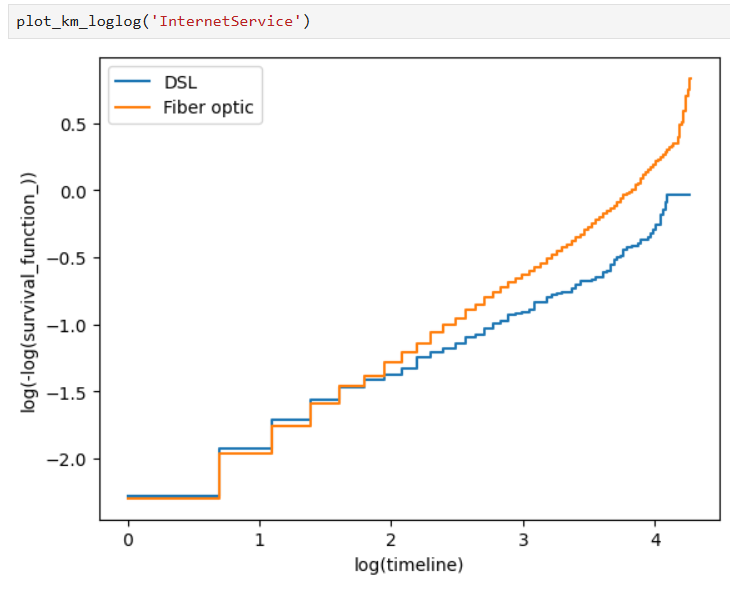
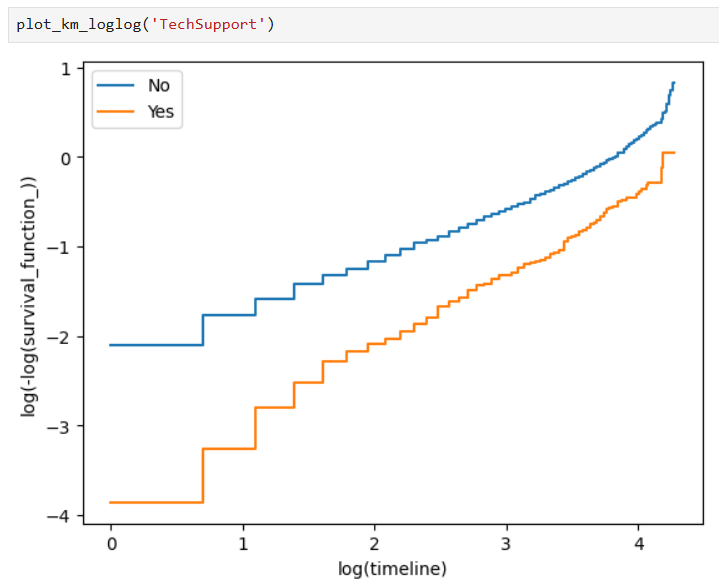
Section 3
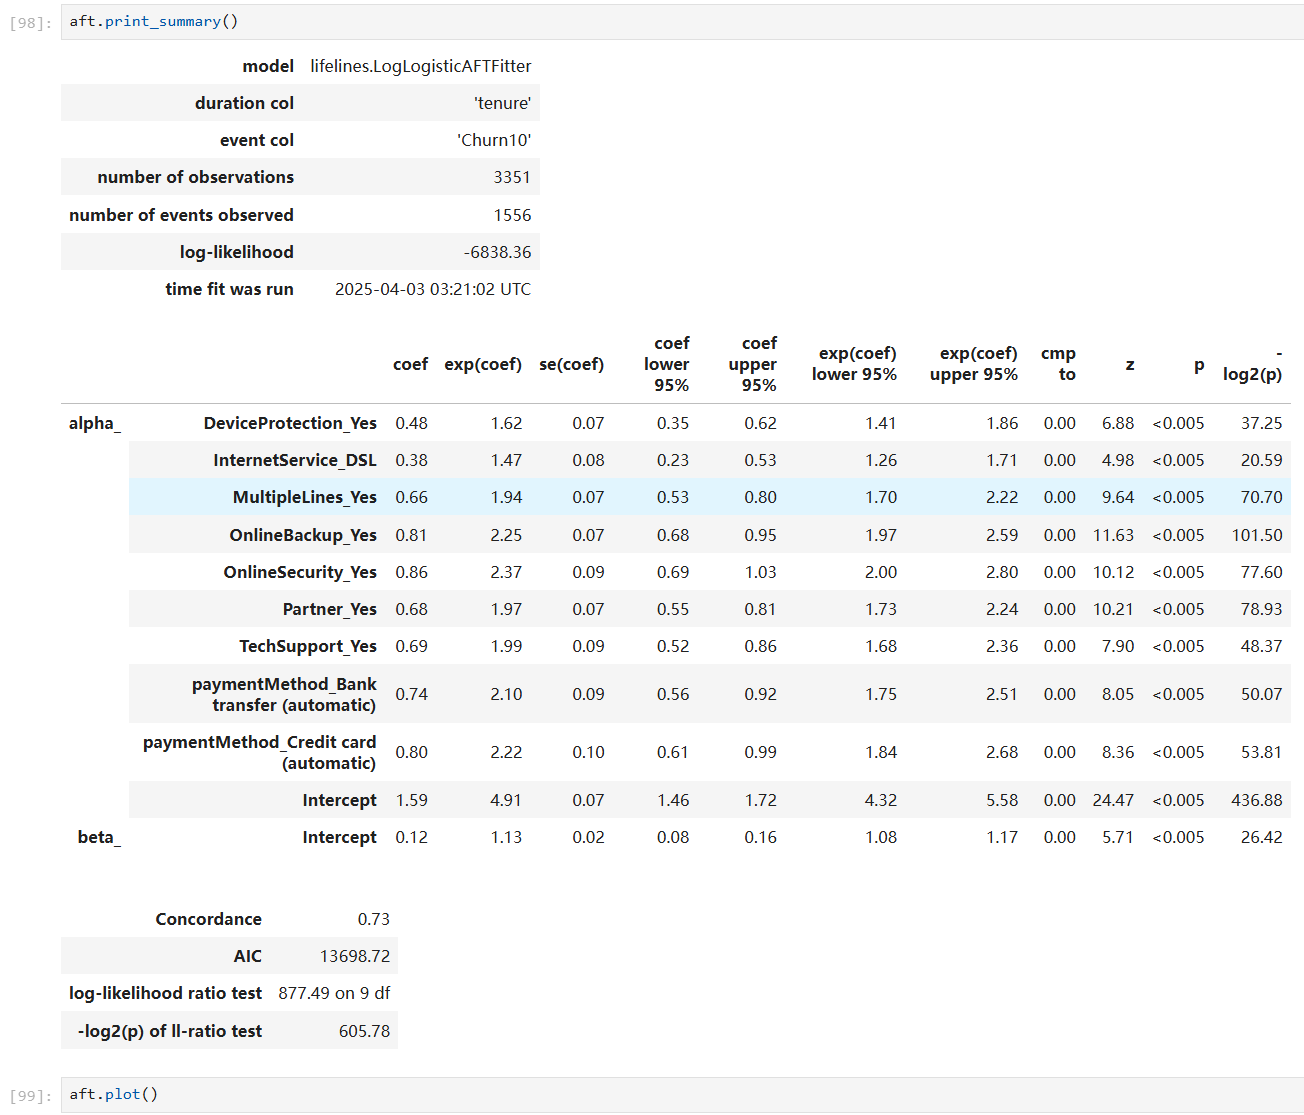
In an accelerated failure time model, we denote the ratio between groups when using log-logistic accelerated failure time as $$\frac{1}{1 + (\frac{t}{\sigma}e^{X\beta})^\lambda}$$.
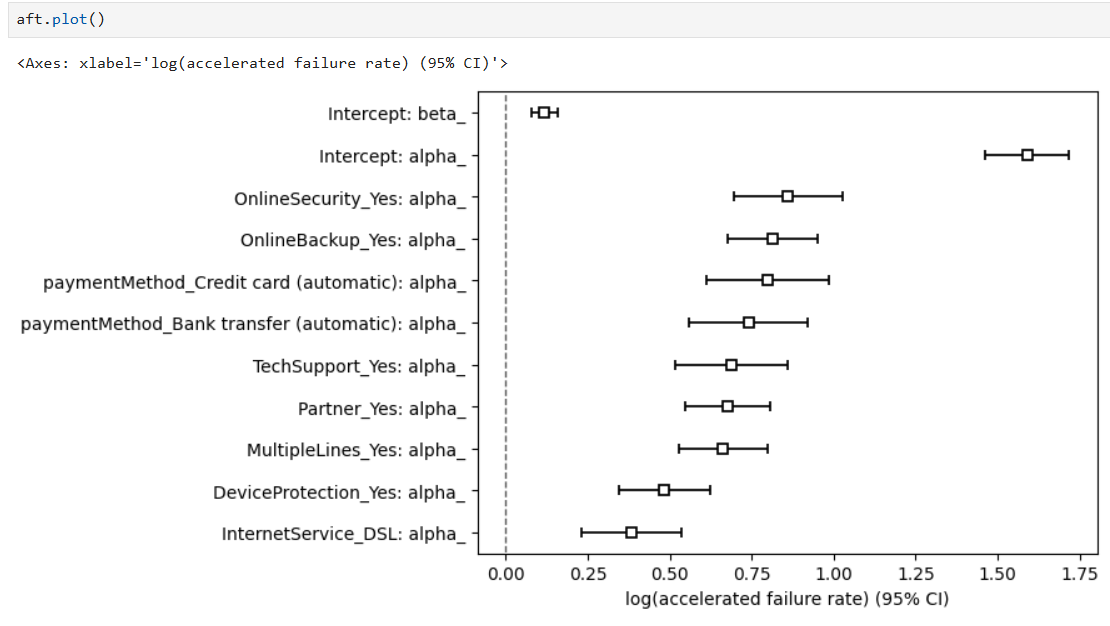
After converting the values of categorical variables to 0 or 1, we have our fitted model:
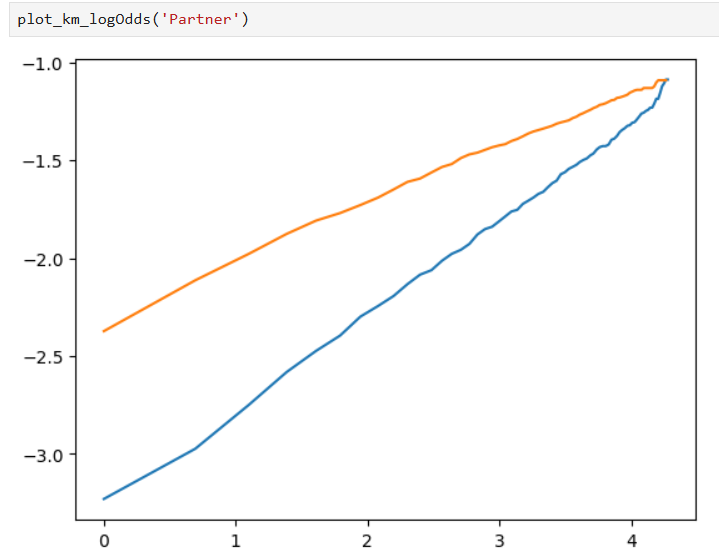
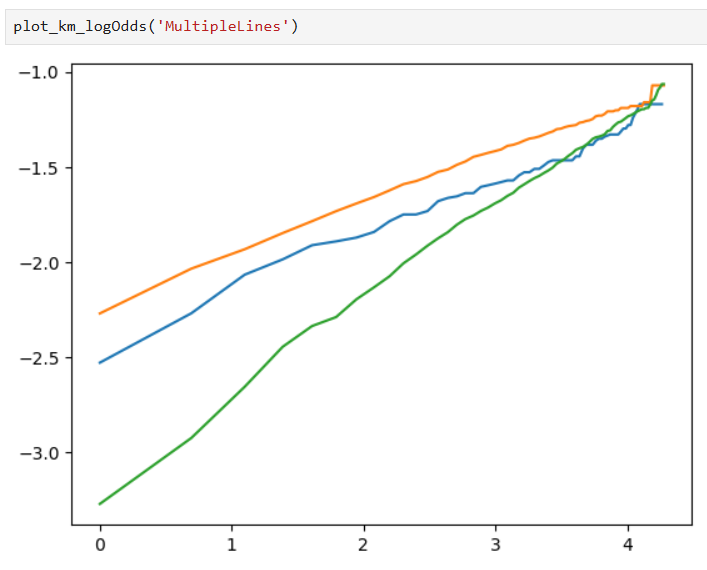
Some plots are made to test our assumptions: the model adheres to the Proportional Odds assumption if lines in the plot are parallel, and the specified distribution is appropriate for this model if the lines are straight.
Section 4
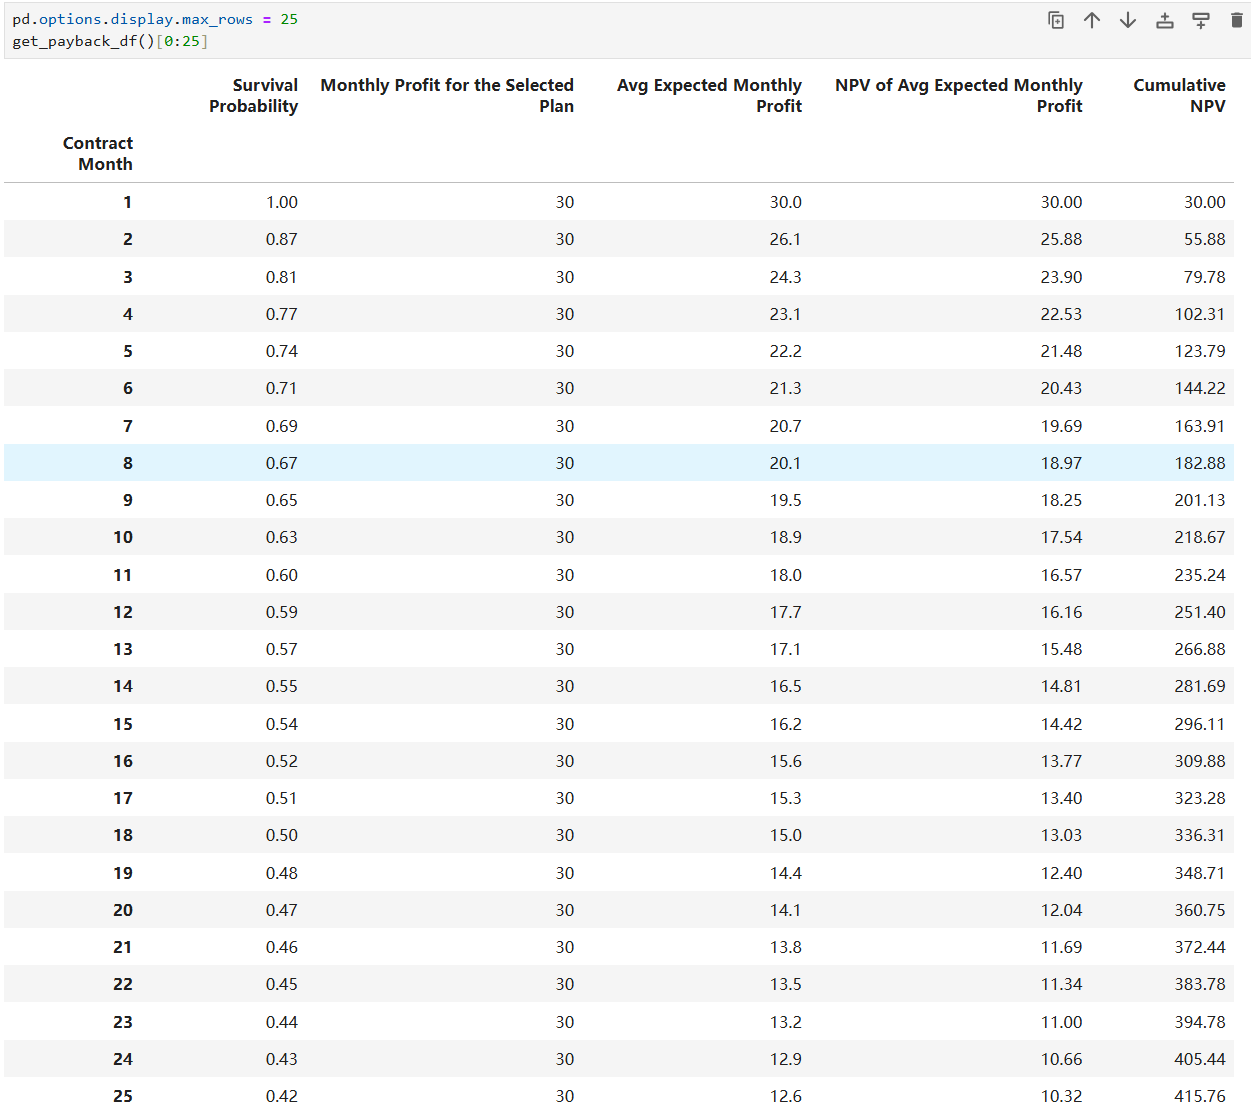
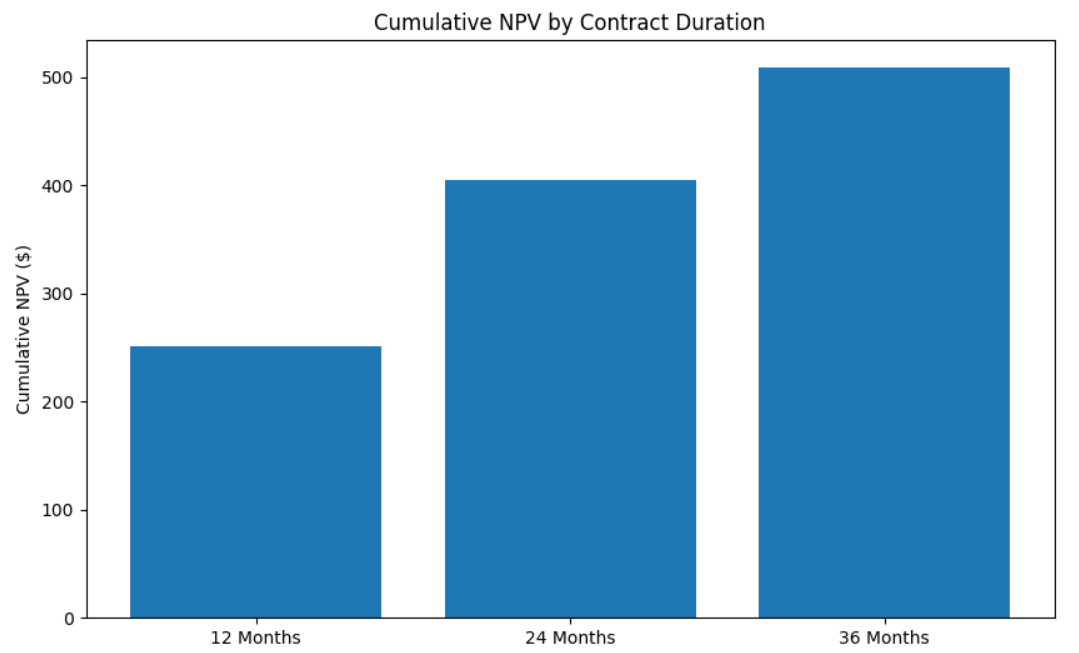
With the results above, we can make inferences and plots about more information, e.g. future profits: